Machine Learning to Support Success and Combat Inequity
Academic Data Analytics Briefing Document | February 2023
Prepared By: Nathan Greenstein, Grant Crider-Phillips, Claire Matese, Sung-Woo Choo
Executive Summary
The University of Oregon’s Academic Data Analytics Unit (ADA) is pleased to share results and reflections from a project that harnesses machine learning in service of student equity and success. In collaboration with the Division of Undergraduate Education and Student Success (UESS), ADA began with two ambitious goals. First, we sought to help UESS support first-year students proactively rather than reactively by predicting winter term retention before students matriculate. Second, we set out to pilot a process of transparent, responsible machine learning performed by the University’s own experts. This project – the first of its kind at the UO – has achieved unprecedented progress towards both goals.
Using a process that prioritizes equity and trust, ADA developed a machine learning model that predicts winter term retention three to five times as successfully as alternatives. To ensure that our work purposefully tackles existing inequities instead of unintentionally cementing them, our team continually sought UESS’s expertise on student and advisor needs to frame the project, review data, and evaluate model performance with respect to equity guardrails. All told, this project has shown that it is possible to leverage machine learning, put inclusivity and transparency first, and achieve meaningful results.
Introduction
Research shows that timely interventions can help institutions like the University of Oregon (UO) improve student success and achieve more equitable outcomes. At their best, such interventions are provided directly to the students who need them most, and are proactive rather than reactive (Astin, 1984; Kuh et al., 2011; Tinto, 1987). Taken together, these points present a challenge: it is difficult to know which students are likely to struggle before they are struggling. This is especially true of student outcomes like retention, which are driven by a host of academic, cultural, and financial factors. To address this challenge, the Academic Data Analytics Unit (ADA) began a collaboration with the Division of Undergraduate Education and Student Success (UESS) in the fall of 2021. Together, we set out to use machine learning to predict which first-year students are at risk of not returning for their second term, and to present our predictions before these students matriculate, allowing UESS ample time to offer support proactively.
This project has two goals: to serve students by facilitating timely intervention, and to pilot a process of transparent, responsible machine learning performed by UO’s own subject matter experts. Our model is designed to be used each summer to identify incoming students who are the least likely to return for their second academic term. During the first weeks of fall, UESS and other advisors use this resource to focus their outreach such that students with higher predicted risk receive the support they need to remain enrolled and succeed. While developing the model, ADA worked closely with UESS to prioritize transparency and equity. To ensure that the model combats existing inequities instead of reinforcing them, we included a range of voices when making key decisions, and we carefully tested our model for bias.
The model we developed performs several times better than alternatives, across multiple measures of performance. This document discusses the motivation and context for this project, ADA’s approach to the machine learning process, and the performance and fairness of the model.
Motivation & Context
Postsecondary administrators know that early intervention can improve student success and equity, but logistical realities force institutions to prioritize which students receive a given intervention earliest, or at all. Similarly, the literature suggests that negative outcomes experienced at the beginning of a student’s college career can disrupt their progress in ways that are difficult to recover from. By the same token, interventions generally work best when they prevent a negative outcome, rather than react to it (Astin, 1984; Kuh et al., 2011; Tinto, 1987). However, constraints on resources like staff, facility space, and funding mean that not every student can receive every intervention, and not all students can receive any given intervention at the same moment in time. These facts make it important to have timely insight into which students are at greatest risk for negative outcomes, especially since the burden of such outcomes tends to fall disproportionately on the most vulnerable students, compounding existing inequities (Swail et al., 2003).
One such outcome is non-retention, which is damaging to both individual students and their institutions. At UO, UESS strives to improve retention by offering outreach to first-year students early during fall term. However, because there are naturally far fewer advisors than students, not all students can meet with their advisors within the first few weeks of the fall term. Thus, to have the greatest possible impact, UESS sought a way to identify students at highest risk for negative outcomes so that it could offer them prioritized outreach for early advising. ADA set out to meet this need.
Before this project, UESS prioritized students with low predicted first-year GPAs. These predictions came from a linear regression model using eleven variables, with high school GPA the main driver among them. Although UESS hoped to instead prioritize their early advising intervention based on winter retention likelihood, the existing model could not predict retention accurately enough to allow this. This limitation is likely driven by several factors. Most simply, winter non-retention is rare at the University of Oregon – only approximately 4% over the past ten years. Moreover, retention is a relatively erratic outcome, as it is driven by a blend of academic, social, cultural, familial, and financial factors unique to each student’s experience (Ziskin et al., 2009). These difficulties were compounded by the fact that predictions were needed before students matriculate, when only limited data is available, in order to support the accelerated timeline that is essential to this intervention.
This challenge – to predict a mercurial outcome using only the data available before students’ college careers have begun – struck ADA as one that might be met through machine learning. However, some stakeholders maintain healthy skepticism towards machine learning, especially regarding transparency and equity. Such concerns are understandable given the past shortcomings of high-profile projects by technology companies, but we believe that such issues are consequences of faulty processes, not inherent to machine learning. Like many tools, machine learning can do good or harm, depending on how it is wielded. We set out to wield it for good by meeting the need for challenging predictions while piloting a process that is transparent, inclusive, and fair.
A Process for Responsible Machine Learning
Past applications of machine learning, both within the UO and beyond, have aroused reasonable misgivings among those concerned with accountability and student equity. One such application was a machine learning solution for predicting student risk that was produced for the UO by a third-party vendor. Due to its proprietary nature, this product offered sparse visibility into how it was developed, which variables it considered, and how well it performed for students belonging to vulnerable groups. This lack of transparency led to a lack of trust in the model’s ability to support equitable advising practices, which undermined confidence in the model. More broadly, it has come to light that certain machine learning solutions serve some groups better than others (Hardesty, 2018), or worse, exacerbate systemic inequities (Angwin et al., 2016; Dastin, 2018; Feathers, 2021). Those aware of such issues might reasonably worry about the unintended consequences of a new machine learning initiative. We applaud this regard for the wellbeing of potentially vulnerable students, and we set out to complete this work in a manner that places concerns like these front and center.
Since the earliest stages of the predictive modeling process, ADA has collaborated closely with UESS, demonstrating a major advantage of performing machine learning work in-house. A machine learning solution is most valuable when designed around the needs of those who will use it, and we believe that it is only truly successful if it inspires trust in users and other stakeholders – namely advisors and students, in this case. To that end, ADA and UESS convened frequently, and each group openly asked questions and offered feedback to the other. As decision points arose, ADA outlined technical considerations and tradeoffs, and UESS responded based on their knowledge of student and advisor needs. This allowed us to answer fundamental questions like the following (plus myriad smaller ones) with full transparency and the trust that it fosters:
- What limitations of the existing system should we seek to improve upon?
- How early should predictions be available each year?
- What is the maximum number of at-risk students who should be identified?
- What information about each student should be provided to advisors?
- Which predictor variables can we responsibly include in our model?
- How should we define equity in the context of this model?
- How should we measure and report on this model’s predictive performance?
We applied this inclusive and transparent approach through each stage of model development. To gather data, we worked with numerous offices within the UO, including Admissions, Financial Aid, Information Services, Housing, Clark Honors College, Student Orientation Programs, First Year Programs, Athletics, and the Registrar. In addition, we assembled publicly available data on high school characteristics and neighborhood opportunity to enrich the model, with a particular eye for capturing social disparities such as geographic differences in upward mobility. Throughout, UESS reviewed the data we select to ensure that it was suitable from a student equity perspective and would not undermine the trust and privacy of students and advisors.
Finally, as our model began to produce results, ADA and UESS worked together to ensure that it was fair and equitable. Our unit outlined theoretical approaches to defining and measuring bias, and UESS helped select the approaches best suited to our particular context. This stage also relied on input from faculty in the Philosophy department who study data ethics, and, crucially, members of the student body. After we arrived at a shared understanding of what a suitable model should look like, ADA evaluated the model against the agreed-upon criteria for fairness and equity. The model was then put into action only after ADA and UESS were satisfied that it met or exceeded all criteria. This process is covered in greater depth below.
Model Performance
Depending on how performance is measured, ADA’s model predicts winter term retention approximately three to five times as well as alternatives, and it performs especially well for potentially vulnerable students. The model leverages 80 variables from University data and 33 variables from public data, captured over the 12 years represented by the 2010 through 2021 student cohorts. Like all machine learning models, ours mines historical data for mathematical relationships between predictor variables and the outcome of interest, then “learns” to generalize these relationships so that it can predict future outcomes when only the predictor variables are known. Internally, the model is built on the XGBoost machine learning framework, which seeks to produce accurate and generalizable predictions by combining many simple models into an “ensemble” model designed to perform better than any one model could on its own.
To evaluate the model’s performance, we compared its predicted outcomes against actual outcomes within the 2021 student cohort, which was withheld from the model during development.1 This is designed to simulate the model’s use with incoming student cohorts, whose data it has never seen before. In discussing the model’s performance, we present two metrics: (a) the proportion of true non-returners found among students identified by the model vs. the proportion among those not identified, and (b) the proportion of all non-returners that are identified by the model. We contextualize these results by comparing them to the same metrics as taken from two hypothetical alternative approaches, one based on low high school GPA (the main input to the previous prioritization scheme), and one based on a random lottery.Among the 2021 cohort – the one withheld from the model during training – non-returners make up 14% of the group of students selected by the model (i.e., 64 among 450), whereas non-returners make up 3% of the group not selected. In other words, the model flags a group of students that is 4.6 times as rich in non-returners than the group it does not flag. For comparison, a hypothetical approach based directly on high school GPA provides no appreciable benefit, yielding two groups with non-returners making up 4% of each. An approach based on a random lottery does the same. This can also be considered from an advisor’s perspective: when meeting with students identified by ADA’s machine learning model, an advisor would expect to encounter a non-returner once for each six students seen. When meeting with students identified by high school GPA or random lottery, an advisor would expect to encounter a non-returner once per 25 students seen. These results are visualized in Figure 1.
Figure 1: Model Performance, Dot Visualization
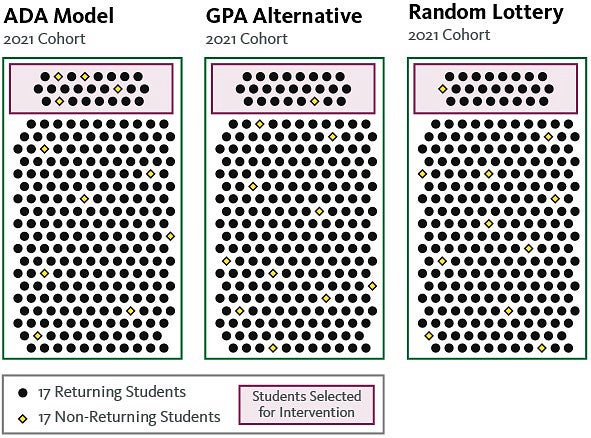
Put differently, among the 2021 cohort, the model identifies 35% of all non-returners. Focusing specifically on potentially vulnerable students – simplistically defined here as first-generation students and those belonging to traditionally underserved races and ethnicities – the model identifies 45%. For comparison, a hypothetical approach based directly on high school GPA identifies only 11% of non-returners, and a random lottery identifies only 10%. In other words, by identifying students using our model instead of identifying students with low high school GPAs, results suggest that UESS can proactively reach out to 3.2 times as large a share of non-returners, and 3.4 times as large a share of potentially vulnerable non-returners. These results are visualized in Figure 2.
Figure 2: Model Performance, Area Visualization
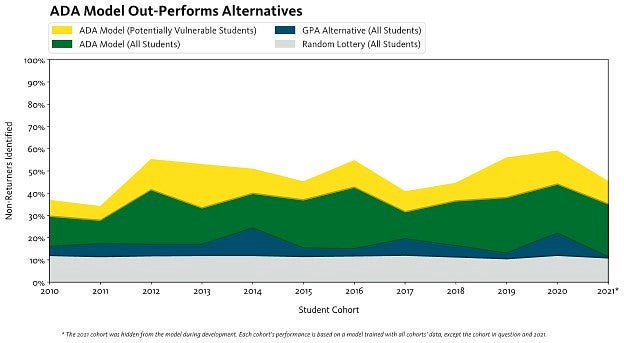
* The 2021 cohort was hidden from the model during development. Each cohort’s performance is based on a model trained with all cohorts’ data, except the cohort in question and 2021.
These results establish our model as a valuable tool to identify students at risk of not returning for their second academic term. Although not every non-returner is identified, many intimate aspects of the student experience that contribute to non-retention cannot practically – and should not, ethically – be known to us. For example, a parent’s layoff or a sibling’s declining health could precipitate non-retention, but we do not know a student’s risk for these events, nor can we, especially without violating student privacy. Thus, we see great value in even an imperfect model that allows advisors to work with a non-returner once per six students seen, as opposed to once per 25 students seen. This gain has potential to make a deeply meaningful difference in students’ lives.
Equity & Fairness
As described above, ADA centered equity and fairness in our machine learning process. Before beginning this project, we pledged to put the final model into service only if it met our standards for fairness and demonstrably resisted existing biases, and to do this in close consultation with stakeholders like UESS. This section describes how we conceived of equity in the context of this model, the specific standards we set, and the model’s performance relative to them. We conclude with the limitations of this work and potential future enhancements.
When considering a new application of machine learning, developers must conceive of equity in a way that is tailored to the project’s specific context. ADA undertook this work with the help of UESS, scholars of data ethics, and student leaders. The relevant deliberations cannot be covered fully here, but two crucial decisions merit mention.
First, we determined that it is acceptable – desirable, even – for the model to predict non-retention at higher rates for potentially vulnerable groups than for their less-vulnerable counterparts. In a contrasting example, evaluators might forbid a model used for bank loan decisions from issuing approvals at a higher rate for white applicants than for applicants of color. However, since our model aims to allocate a supportive resource where it is needed most, and we know that need can relate to traits like race due to existing systemic inequities, we deemed it sensible and unproblematic for our model to allocate early advising at higher rates for some groups than for others, including along sensitive lines such as race and gender. In other words, to be equitable, our model need predict early advising at equal rates for all groups.2
Second, we determined that it is unacceptable for the model to serve potentially vulnerable groups with a substantially lower level of predictive accuracy than it does their less-vulnerable counterparts. Setting predicted rates of non-retention aside, one can envision a scenario where a model is very good at predicting accurate outcomes for white students, but generates relatively inaccurate predictions for students of color. This scenario is of particular concern when a majority of the historical data used to train the model describes white students. With that in mind, we deemed it problematic for our model to perform substantially worse for certain groups, especially along sensitive lines such as race and first-generation status. In other words, to be equitable, our model must not substantially under-serve potentially vulnerable groups in terms of accuracy.
Having arrived at an understanding of equity in the context of this model, ADA and UESS developed a set of criteria against which the model would be evaluated to test whether it aligned or did not align with our understanding of equity. Because these criteria lay out concrete ranges within which our model’s behavior must lie before it is put into service, we refer to them as “guardrails.” They are as follows:
- The model must perform at least 85% as well for potentially vulnerable groups as it does for all students.
- The model must perform at least 75% as well for less-vulnerable groups as it does for all students, except when adjusting the model would reduce total number of non-returners identified.3
Potentially vulnerable groups for which the above criteria are applied include:
- First-generation students.
- Any student belonging to any underrepresented minority race or ethnicity group or groups, taken in aggregate.
- Students belonging to each underrepresented minority race or ethnicity group, taken individually.
Note that the guardrails specify comparisons to “all students.” This decision was made for several reasons: because a student can belong to multiple groups, for the sake of consistency, and to avoid establishing any particular group as the norm.
Without requiring any modification, our model fell comfortably within the guardrails established. The table below reports model accuracy for each potentially vulnerable group relative to the “All Students” comparison group, whose performance is displayed as the reference point of 100% and used as the denominator for other cells in each row.4
Table 1: Model Performance Relative to All Students
| Relative Model Performance* | All Students | First-Generation | URM: All | URM: Black/African American | URM: American Indian/Alaskan Native | URM: Native Hawaiian/Other Pacific Islander | URM: Hispanic/Latinx |
|---|---|---|---|---|---|---|---|
| Training Cohorts (2010-2020) | 100% | 149% | 146% | 172% | 134% | 103% | 147% |
| Validation Cohort (2021) | 100% | 129% | 149% | 110% | 120% | ** | 160% |
*Percentage of non-returners identified
**Cells representing fewer than 10 students are not reported
As the table indicates, considering both training and validation cohorts, the model performs at least as well for potentially vulnerable groups as it does for all students. This is true of the model in its natural state, under which it maximizes the total number of non-returners identified, with no adjustment. Therefore, the model falls within our guardrails and does not require adjustment. Had this not been the case, ADA would have employed one of the various peer-reviewed algorithms available in the literature to address bias (AI Fairness 360 - Resources, n.d.), until such a point as the adjusted model’s performance fell within the guardrails.
Although this process has left us confident that our model behaves in a manner consistent with our equity goals, there is room to explore extended equity review in the future. For example, although students may belong to multiple potentially vulnerable groups, our current analysis does not consider intersectionality. Additionally, we hope to incorporate input from a broader range of stakeholders in the future, especially during the process of establishing concrete guardrails. ADA aims to move in this direction when this model is employed in future years, and when developing additional models.
Conclusions
This project sought to promote student success and advance equity by facilitating timely intervention, and to pilot a process of transparent, responsible machine learning. Consulting with a range of stakeholders, from UESS to members of the student body, we developed a machine learning model that performs three to five times as well as alternatives. We then intentionally set requirements for equity and fairness and tested the model against them. We hope that this initiative can serve as a blueprint for responsible use of machine learning to promote student success and advance equity, both at our institution and beyond.
1 As described, 2021 data was withheld during model development and testing. All assessments of performance and equity found in this document are based on the model’s handling of 2021 data, which it had never encountered before. However, at the very end of the modeling process, the model was re-trained with 2021 data included so that it could make the best possible predictions for the incoming 2022 cohort. This is standard practice in the machine learning industry.
2 Under the same rationale, we chose to supply the model with race and other sensitive demographics, rather than withhold them. This choice is especially sensible given the well-documented ability of complex models to infer sensitive attributes from other data points, e.g. zip code.
3 Because of its second clause, this criterion is effectively a stop condition designed to indicate when we have gone too far down the hypothetical path of adjusting the model to perform better for potentially vulnerable groups than it did naturally. As discussed below, this measure was not necessary. In the model’s natural state – i.e. maximizing the total number of non-returners identified, irrespective of sensitive attributes – we set no limit to how much better the model can perform for potentially vulnerable groups than for all students.
4 Note that the “All Students” group’s performance is based on percent of non-returners identified. Therefore, for the validation cohort, the underlying value is 35%, as reported in the “Model Performance” section of this document.
Acknowledgements
The authors wish to thank our colleagues in UESS for their thoughtful and ongoing engagement in this project. We are especially grateful to Kimberly Johnson, Jesse Nelson, Grant Schoonover, Celena Simpson, and Hiroe Sorter. We also thank our colleagues in the Philosophy department – Ramón Alvarado, Colin Koopman, and Paul Showler – for their data ethics expertise. Finally, we are grateful to our student representatives for their support, leadership, and advocacy on behalf of their peers – Jason Baumann, Emma Koontz, Julia Lo, and Laurel McPherson. Your voices make this work possible.
References
AI Fairness 360—Resources. (n.d.). Retrieved January 13, 2023, from https://aif360.mybluemix.net/aif360.mybluemix.net/resources
Angwin, J., Larson, J., Mattu, S., & Kirchner, L. (2016, May 23). Machine Bias. ProPublica. https://www.propublica.org/article/machine-bias-risk-assessments-in-cri…
Astin, A. W. (1984). Student Involvement: A Developmental Theory for Higher Education. Journal of College Student Personnel, 25(4), 297–308.
Dastin, J. (2018, October 10). Amazon scraps secret AI recruiting tool that showed bias against women. Reuters. https://www.reuters.com/article/us-amazon-com-jobs-automation-insight-i…
Feathers, T. (2021, March 2). Major Universities Are Using Race as a “High Impact Predictor” of Student Success. The Markup. https://themarkup.org/machine-learning/2021/03/02/major-universities-ar…
Hardesty, L. (2018, February 11). Study finds gender and skin-type bias in commercial artificial-intelligence systems. MIT News | Massachusetts Institute of Technology. https://news.mit.edu/2018/study-finds-gender-skin-type-bias-artificial-…
Kuh, G. D., Kinzie, J., Schuh, J. H., & Whitt, E. J. (2011). Student Success in College: Creating Conditions That Matter. John Wiley & Sons.
Swail, W. S., Redd, K. E., & Perna, L. W. (2003). Retaining Minority Students in Higher Education: A Framework for Success: ASHE-ERIC Higher Education Report. Wiley.
Tinto, V. (1987). Leaving College: Rethinking the Causes and Cures of Student Attrition. University of Chicago Press, 5801 S.
Ziskin, M., Hossler, D., & Kim, S. (2009). The Study of Institutional Practices Related to Student Persistence. Journal of College Student Retention: Research, Theory & Practice, 11(1), 101–121. https://doi.org/10.2190/CS.11.1.f