Transfer Students at the University of Oregon
Academic Data Analytics Working Paper No. 1 | October 2021
Prepared By: Julie Wren, Ph.D; Claire Matese, M.A.; and Sung-Woo Cho, Ph.D.
Table of Contents
- ACKNOWLEDGEMENTS
- ABSTRACT
- INTRODUCTION
- BACKGROUND ON TRANSFER RESEARCH
- TRANSFER ENROLLMENT
- CHARACTERISTICS OF TRANSFER STUDENTS
- PRIOR INSTITUTIONS
- TRANSFER ENROLLMENT SUMMARY
- TRANSFER ADMISSION FUNNEL
- APPLICATIONS
- APPLICANT CHACTERISTICS
- TRANSFER INSTITUTION TYPE
- APPLICANT FUNNEL
- SUMMARY AND RECOMMENDATIONS
- REFERENCES
- ENDNOTES
Acknowledgements
We would like to acknowledge the campus partners whose contributions enabled us to produce this report. These include the Division of Student Services and Enrollment Management (SSEM), particularly SSEM Research and Assessment and the Office of Admissions, who shared essential data and insights regarding the admissions and enrollment of transfer students. The contributions of Jonathan Jacobs, Director of SSEM Research and Assessment, cannot be overstated. JP Monroe in the Office of Institutional Research also contributed data, as well as a wealth of institutional knowledge. Finally, we would like to acknowledge the prior work in this area by the Divisions of Undergraduate Education and Student Success (UESS), Student Services and Enrollment Management (SSEM), and Student Life. These partners presented to the Board of Trustees in March 2021; however, their work on transfer students has a long history that demonstrates both care and concern for the transfer student experience. We would also like to thank Grant Crider-Phillips for his editorial assistance as well as central communications for their help in designing this document.
Abstract
This paper extends existing institutional efforts to examine the transfer student funnel by exploring ten years’ worth of historical student-level data at the University of Oregon (UO). Although this investigation relies on descriptive statistics, it sets a solid foundation for future analytical work using advanced statistical methods including machine learning techniques. Supporting previous work in this area, initial findings demonstrate a steady and pervasive decline of matriculated transfer students. Diving deeper, this investigation compares institutional transfer data to state and national trends and analyzes academic and demographic characteristics of the transfer population. Over the past 10 years, the demographics have shifted slightly to a more ethnically/ racially diverse transfer student population. Additionally, the academic characteristics of matriculated transfer students have remained relatively stable with the transfer student population continuing to achieve academic success at a rate similar to first-time students. Despite their academic success at the university, fewer transfer students are applying and enrolling at the university. Although this loss can, in part, be attributed to declining community college enrollment and the impact of the COVID-19 pandemic, the declining trend at UO is greater than many of its peers. With changes to the state’s budget model that incentivize resident transfer students and recent legislation focused on the transfer experience, the university should consider naming the transfer student population an institutional priority.
Introduction
The University of Oregon (UO) is a large, public, R1 research institution. The university enrolls approximately 22,000 students annually with undergraduate students comprising over 80% of the student population.1 This current figure represents a steady decline since Fall 2012 when UO had its peak total enrollment and peak undergraduate enrollment, 24,591 and 20,829, respectively. Despite these declining numbers, first-time students have been enrolling at record rates with the highest number of first-time, full-time students enrolling in Fall 2019 (N=4,463). Although this number dropped during the pandemic, enrollment of first-time, full-time students appears strong for Fall 2021.
Coupled with this rise is the loss of transfer students; transfer student enrollment has dropped 33 percent from 4,589 in Fall 2010 to 3,088 in Fall 2020. Despite this loss, transfer students continue to experience similar levels of academic success; full-time transfer students continue to graduate at rates similar to first-time, fulltime students. The current three-year graduation rate for transfer students is 61.3% which matches the four-year graduation rate of first-time, full-time students. Additionally, both full-time, first-time and full-time transfer students have similar 6-year graduation rates, ranging from 70% to 76% across the past six cohorts.2 Although transfer students have experienced success at the university, community college transfer has been a rising concern across the state.
In July 2017, House Bill 29983 was passed to simplify and better align pathways for students to successfully transfer between institutions, maximize credits toward their degrees and certificates, and decrease time-to-degree completion.4 The bill requires statewide “foundational curricula,” now called Core Transfer Maps and major-specific “unified statewide transfer agreements,” now called Major Transfer Maps, that prepare students for transfer into one of Oregon’s public universities in a particular major. In addition to this, Oregon legislation approved 2019 Senate Bill 35 allowing community colleges to offer applied baccalaureate programs6 beginning in Fall 2021. Although the programs must be workforce-oriented, there is substantial overlap between these programs and the programs offered by the university:
- Business management (e.g., accounting, business management, marketing)
- STEM fields (e.g., molecular biosciences, engineering technology, sustainable building technology)
- Health care, wellness, and safety (e.g., health and wellness, child, youth, and family studies, behavioral healthcare, public health administration)
- Trades, construction, and manufacturing (e.g., advanced manufacturing and materials)
- Information Technology (e.g., computer science, data analytics, cybersecurity)
- Education (e.g., teacher education)
- Other (e.g., interior design)
Beyond this, in 2020, the Higher Education Coordinating Commission (HECC) updated its Student Success and Completion Model (SSCM) for the 2021-2023 biennium to incentivize resident community college transfer.7 The revised model now provides institutions with full funding for resident community college transfer students who earn a bachelor’s degree. Prior to this, these degrees were discounted. While the reduced funding was intended to reflect shared instructional effort, the revised model aims to enhance cross-sector collaboration by adding a bonus for community college transfers. This change provides additional value for the recruitment, retention, and graduation of resident students enrolling from community colleges. More recently, in July 2021, the state mandated practices related to the transfer of academic credit requiring public post-secondary institutions of education to adopt a common course number system to increase the transferability of lower division courses with similar learning outcomes.8
Given the state’s level of investment in college transfer, the university has dedicated time to better understand the transfer experience. In March 2021, as part of its SemiAnnual Report on Student Success, three university units presented on transfer and non-traditional students to the Board of Trustees.9 The presentation provided a 10-year history of declining transfer enrollment; retention and graduation rates that increase with the number of transfer credits; topics and concerns of transfer students; and current and future investments to better support this student population. Overall, the team pointed to the need for additional investment by the university to address the declining student population. They identified challenges that were outside the university’s control, such as declining enrollment in community colleges and aggressive transfer scholarship programs; and inside the university’s control, such as cost of attendance, perceptions of the university as exclusive and not transfer friendly, lack of online degree programs, and difficulty navigating the system. While some of the recommendations would require marginal investment from the university (e.g., a peer mentorship program, shifting the delivery of transfer orientation), others would require significant investment in the academic infrastructure (e.g., online programming, expanded degree programs, night and weekend courses).
With the legislative focus on the transfer student experience and institutional investment in the transfer population, continued investigation of this student population is warranted. This paper aims to build upon prior work by exploring ten years’ worth of historical student-level data comparing entering transfer cohorts and transfer applicants across select demographic and academic characteristics. Further, this investigation provides a contextualized understanding of the loss of transfer students by comparing the institution to state and national trends. Finally, this paper serves as a launching point for future analytical work using advanced statistical methods, including machine learning techniques, to better understand transfer at the University of Oregon.
Background of Transfer Research
Interest in college transfer garnered enough national attention that in 2010 then-U.S. Secretary of Education Arne Duncan appointed the Committee on Measures of Student Success to provide recommendations on how to better track outcomes of community college students. At that time, federal reporting was limited to completions for first-time, full-time students. With funding from the Bill & Melinda Gates Foundation and harnessing data from the National Student Clearinghouse (NSC), the Student Achievement Measure (SAM) was launched in 201310 to address this shortcoming. Endorsed by six higher education associations, SAM provided a more accurate and comprehensive understanding of college completion. Further, SAM allows institutions to benchmark their performance against other peer institutions. Although SAM expanded completion reporting by including transfer students and tracking students across institutions, it has its limitations. These limitations include an exclusive focus on full-time students and reliance on voluntary participation.
Shortly after the launch of SAM, the federally appointed Committee on Measures of Student Success launched the Outcome Measures (OM) survey as part of the Department of Education’s 2015-16 Integrated Postsecondary Education Data System (IPEDS).11 The OM survey required institutions to report on the 4, 6, and 8-year degree/certificate completion rates of first-time and non-first-time students. The original OM survey did not allow for disaggregation of completion; specifically, completion included any undergraduate degree or certificate completion. This made direct comparisons across institutions more difficult. Updates to this survey now allow for disaggregation across student type, credit level (full and part-time), Pell eligibility, and completion type. Similar to SAM, the OM survey allows institutions to benchmark their performance against peers but benefits from being compulsory.
Although both the SAM and OM survey are useful tools for providing aggregate information, other systems are leveraged for large-scale examination of transfer outcomes at the student-level. The National Student Clearinghouse (NSC) is one mechanism for this type of research. Although reporting to the NSC is not mandated, the NSC reports that ninety-seven percent of institutions use their Free StudentTracker® to meet Department of Education requirements.12 The National Student Clearinghouse Research Center (NSCRC) uses these data to publish research on enrollment, mobility, completion, and other outcomes of interest. In 2017, NSCRC collaborated with the Community College Research Center (CCRC) to report on community college transfer. Since then, key metrics for benchmarking progress and completion for students transferring from two-year to four-year institutions are updated annually. This report allows for institutional benchmarking based on institutional and student characteristics. For instance, the 2020 Data Update reports that community college students who transfer-in to 4-year institutions and enroll exclusively full-time have a much higher completion rate than those students who either attend exclusively part-time or have mixed enrollment patterns: 63.7% versus 5.3% and 41.9%, respectively. Disparate outcomes are also noted based on student income; students with higher income have better completion rates than those with lower income (52.7% vs 39.3%). Finally, institutional aspects are also related to outcomes with “moderately selective” institutions having much better outcomes than “nonselective” institutions and “very selective” institutions having the best outcomes, at 43.0%, 26.7%, 53.2%, respectively. These findings highlight just some of the ways the benchmarks are disaggregated but, unfortunately, disaggregation at the institutional level is not possible.
These disparate and incomplete systems make the examination of college transfer complex and time-consuming. At the same time, the existence of these systems call attention to the importance of this student population. This paper aims to establish a shared understanding of the transfer landscape and build consensus for future analytic work of the transfer student population among relevant institutional stakeholders.
Transfer Enrollment
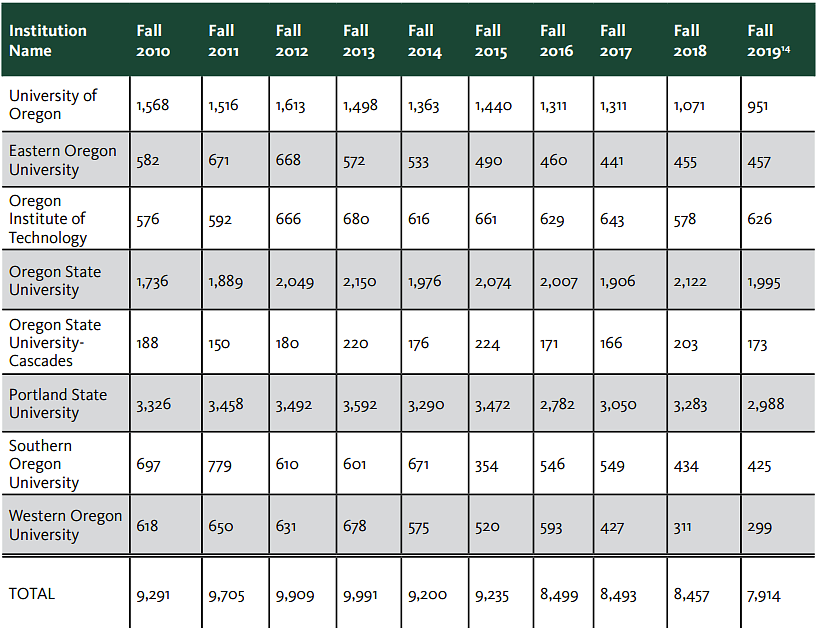
Since 2010, new transfer enrollment has dropped 42%, from 1,976 in 2010-2011 to 1,146 in 2020-2021 (see Figure 1). The first major drop in transfer enrollment was in the 2013-2014 academic year and, from that point on, year over year drops in new transfer enrollment have continued. Although recent declines in transfer enrollment can be, in part, explained by the impact of the coronavirus pandemic on higher education (Causey et al., 2021), the university has experienced a steady loss of new transfer students that predates the pandemic. Further, this sustained loss of transfer students has not been the experience of all former Oregon University System (f-OUS) institutions (see Figure 2). In fact, despite the overall decline in new transfer enrollment among these institutions, Oregon Institute of Technology and Oregon State University have grown their transfer population during this period (2010-2019).
Figure 1. New Transfer Enrollment13
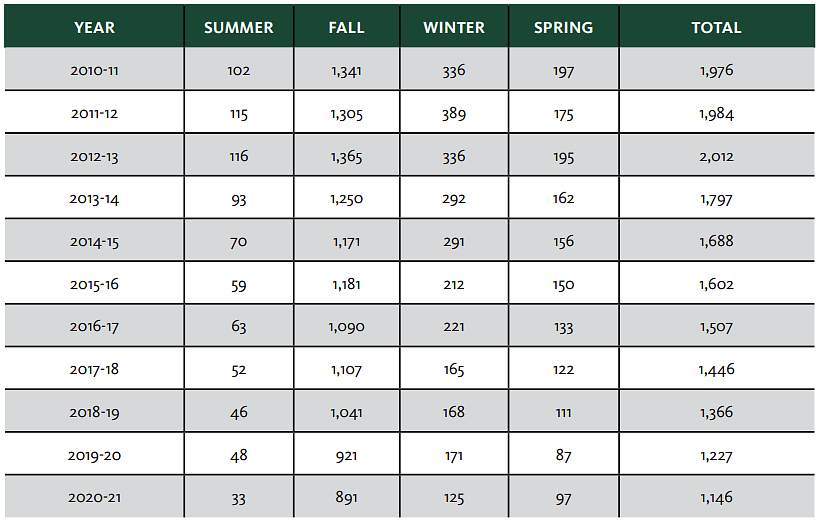
Figure 2. IPEDS Fall New Transfer Enrollment 2010 - 2019, f-OUS Institutions
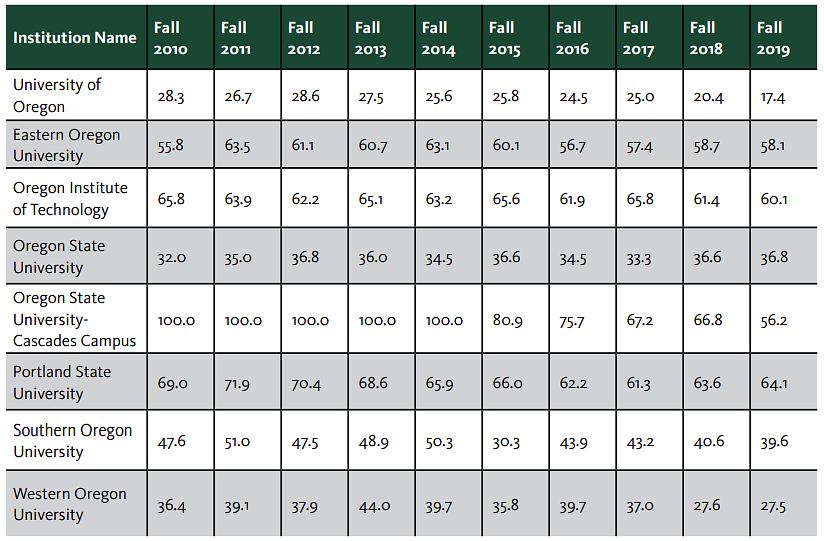
When considering the proportion of new transfer students, this sustained and consistent loss places the university towards the bottom quartile for the proportion of new transfer enrollment in comparison to other institutional members of the Association of American Universities (AAU) and further expands the distance between UO and other Oregon public institutions (see Figure 3). While it is clear the university’s transfer population is declining, it is not well understood where the declines are occurring. Therefore, to better understand this trend, new transfer student enrollment will be further investigated.
Figure 3. New Transfer Students as a Percent of All New Students
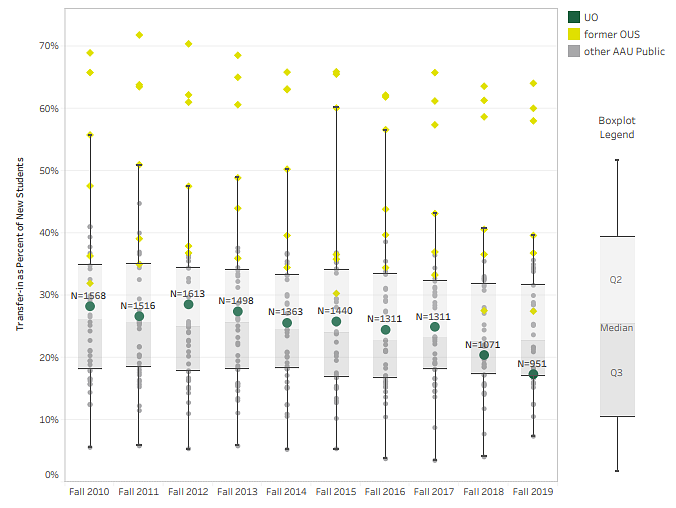
Figure 4. New Transfer Students as a Percent of All New Students, f-OUS Institutions
Local Competitive Landscape
One of the challenges related to this decline is timing. As noted earlier, the transfer experience has been the focus of legislative action within the state. Therefore, there has been an increased amount of attention on the transfer student experience, and within this context, the University of Oregon is not a leader. Although this report does not provide an in-depth analysis of the local competitive landscape, there are a few areas in which the university’s position makes it more challenging to recruit and retain students including lack of online programs, limited institutional funding for transfer students, and higher cost of attendance.
As highlighted in the previous section (see Figure 2), only two Oregon institutions, Oregon State University (OSU) and Oregon Institute of Technology (OIT), have increased the number of transfer students. Both institutions are known for their online programs. Oregon State University’s Ecampus is currently ranked 4th in the nation for Best Online Programs – Bachelor’s by U.S. News & World Report (2021) and offers over 85 online or hybrid programs and over 45 undergraduate programs.15 Similarly, Oregon Tech Online offered by Oregon Institute of Technology advertises seven fully online bachelor’s degree programs and seven degree completion programs.16 In contrast, the university’s UO Online17 offers online courses but does not offer any undergraduate degree or degree completion programs online. While online delivery is a newer initiative for the university, other institutions have well-established online programs and offerings.
Beyond this, robust transfer scholarship programs are also an important factor. In addition to its existing transfer scholarship programs, Oregon State University is now offering Western Undergraduate Exchange (WUE) Scholarships in Fall 2021.18 The WUE scholarship program allows students to attend programs outside of their home state and pay a reduced tuition rate which is no more than 150% of resident tuition. With a shrinking in-state transfer population, OSU has pivoted to recruit more nonresident transfer students. Although Portland State University (PSU) has not increased its transfer student population, it educates the largest number of transfer students in the state. PSU’s “Transfers Finish Free” program is only three years old but offers a last-dollar scholarship covering full-time tuition and fees for eligible Oregon residents.19 Both of these scholarship programs require little effort for students as no additional applications are required, since transfer students are considered for these awards as part of the admission process. Although the UO has begun to explore this type of tuition discounting via the Transfer Duck Scholarship piloted in Fall 2020, there is still relatively little institutional financial support provided to transfer students. Figure 5 provides the amount of scholarship and grant aid awarded to full-time transfer students by residency. While there have been modest increases in the average amount of aid disbursed to both resident and nonresident students, those increases have not kept pace with increases in tuition and fees. For resident students, relatively fewer students are receiving aid now than in 2010. In contrast, relatively more nonresident students are receiving aid, likely driven by the increasing proportion of Pell-eligible students in this population.
Figure 5. First-Term Scholarship and Grant Aid for Full-time Transfer Students by Residency
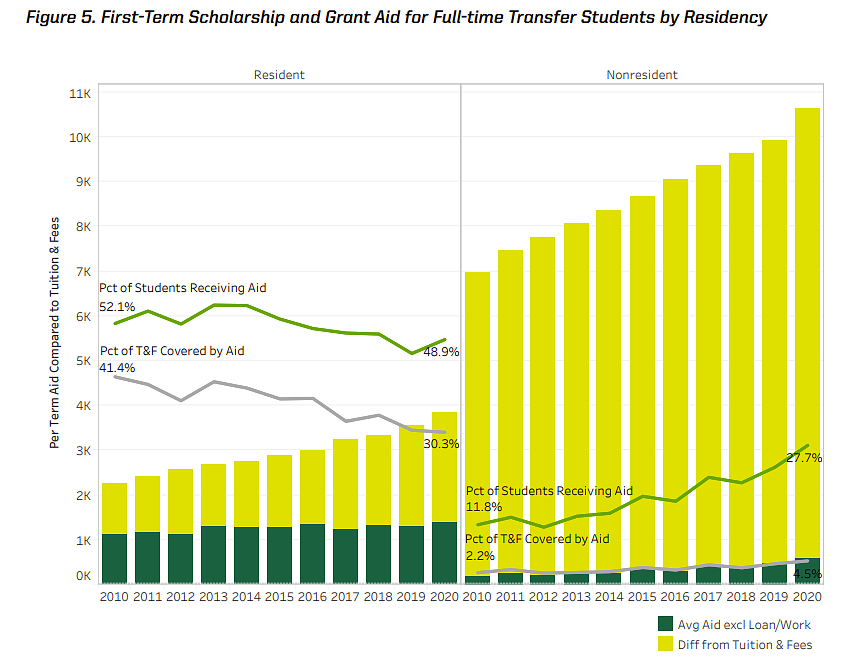
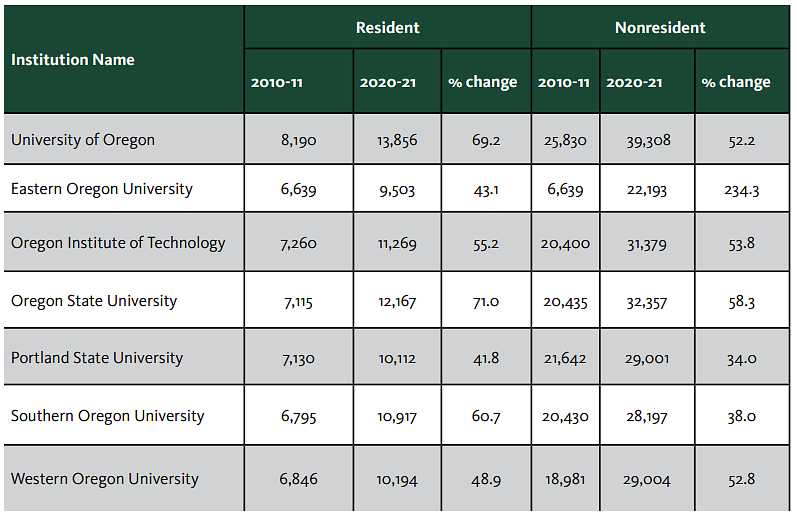
Although institutional aid cannot be benchmarked, tuition and fees can. The University of Oregon continues to be the most expensive option in the state (see Figure 6). Over the past 10 years, UO’s tuition and fees have increased substantially – by 69% for resident students and 52% for nonresident students. Although several former OUS institutions have increased tuition and fees by larger percentages in the last ten years, the cost to attend the UO currently exceeds the nearest peer by $1,689 for resident students and by $6,952 for nonresident students.
Figure 6. Change in Tuition and Fees 2010 to 2020, f-OUS Institutions
Characteristics of Transfer Students
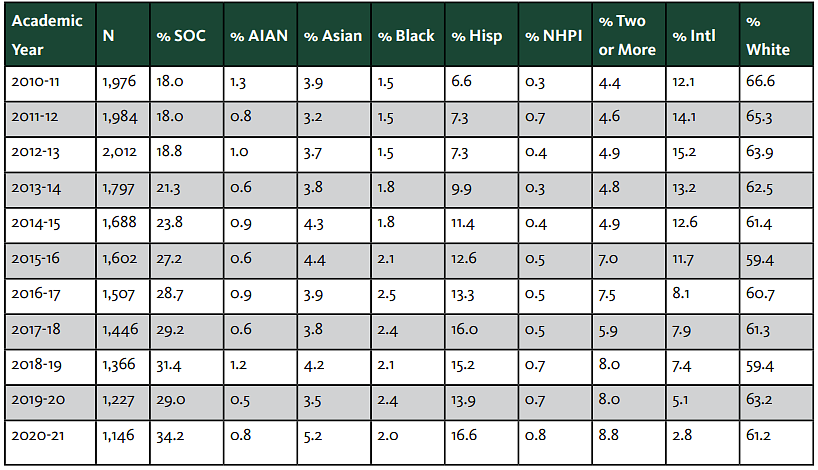
To better understand the institutional trend of declining transfer enrollment, the shifting characteristics of transfer students were further investigated. Since 2010-11, the number of new international transfer students has dropped 87%, from 239 to 32. Unlike other transfer characteristics where the drop was steady and proportional, this drop has been rapid and large with international students representing only 3% of new transfer enrollment, down from 12% in 2010-11 (see Figure 7). Anti-immigration laws and restrictions imposed by the Trump administration are associated with early drops in the international student population with the global COVID-19 pandemic further reducing these numbers.
While it will take time to rebuild the international transfer student population, the proportion of students who identify as American Indian or Alaska Native, Asian, Black or African American, Native Hawaiian or Other Pacific Islander, Hispanic or Latino, or Two or More races has been increasing. The percentage of new transfer students of color20 has increased from 18% in 2010-11 to 34% in 2020-21 with students who identify as Hispanic or Latino increasing at the greatest rate (see Figure 7). Despite increasing in proportion and number, the number of students of color has fluctuated across the years with the height of enrollment in 2015-16, with 436 new transfer students.
Figure 7. New Transfer Students: Federal Categories Ethnicity/Race
While the racial/ethnic composition of the new transfer students has shifted, other entering student characteristics have remained relatively stable (see Figures 8 through 10). Transfer students continue to average 13 credits and enroll full-time in their first term, attend 1.6 institutions prior to UO, and have a nearly 3.2 transfer GPA. The uptick in the proportion of resident students is, in part, explained by the loss of the international student population and the impact of the COVID-19 pandemic on student academic behaviors (Soria, 2020).
Figure 8. New Transfer Students: Entering Student Characteristics, Demographics
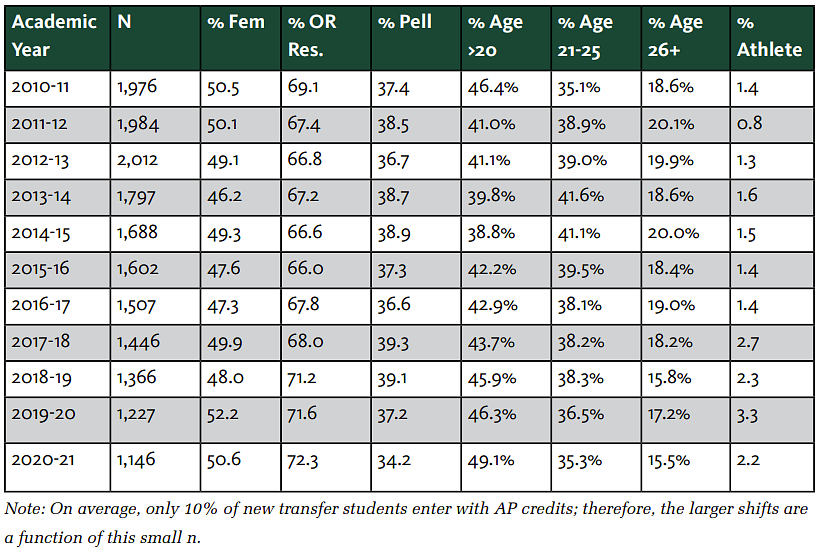
Figure 9. New Transfer Students: Entering Student Characteristics, Academic Characteristics
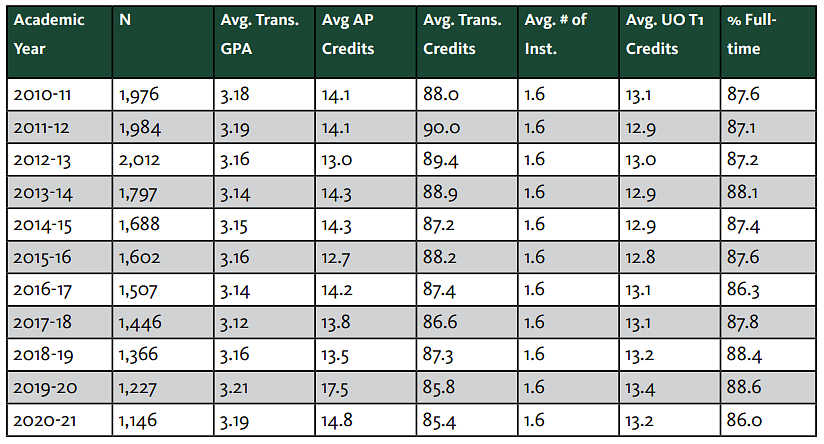
Figure 10. New Transfer Students: % Class Standing and Average Transfer Credits
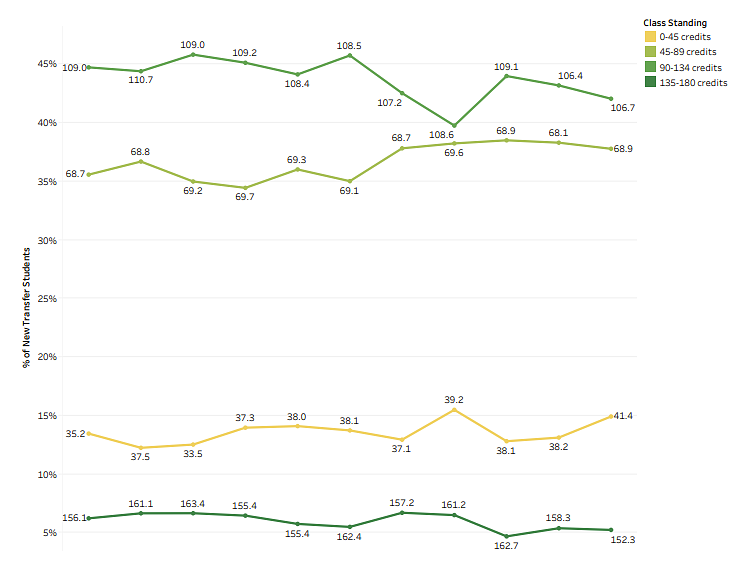
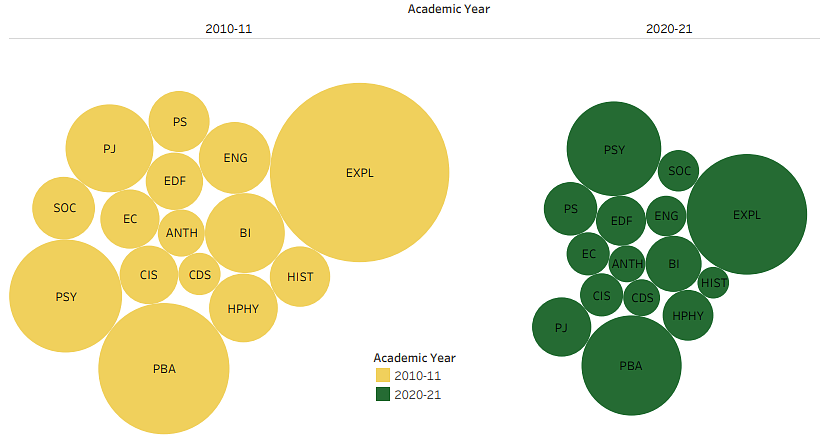
Proportionally, academic interest across the colleges has remained relatively stable apart from the decline in exploring/undeclared students (see Figure 11; these data are also presented visually in Figure 12). The proportion of new transfer students who have not declared a major at the time of enrollment has dropped from 23% to 18% which is similar to the decline noted among the first-time, full-time students.
Figure 11. First-Term College for New Transfer Students
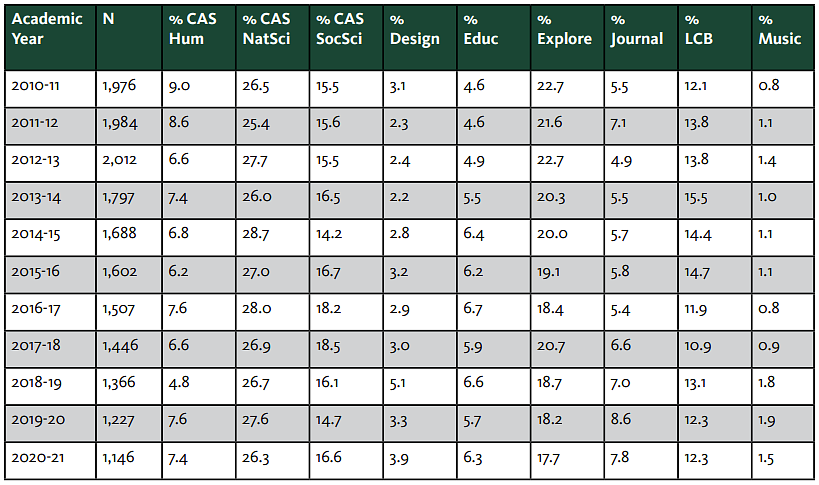
Figure 12. Top Majors for New Transfer Students across Time
Prior Institutions
Slightly over 70% of new transfer students enroll from a two-year institution.21 While the proportion of students enrolled from a two-year institution has remained relatively stable (see Figure 13), the number of students has dropped by 38%, from 1,304 to 811. Oregon Community Colleges (ORCC) represent the largest institution type for incoming transfer students. Although, historically, the f-OUS institutions were the second largest institution type, two-year institutions in California have surpassed f-OUS institutions in proportion and number. Transfer students from California’s two-year institutions now comprise 12% of the new transfer population. Despite the increase in proportion, there has been a 22% loss in new transfer student enrollment from 177 to 138. Foreign institutions have demonstrated the greatest loss, now comprising only 1.3% of the new transfer student population which is down from 8% in 2010-11.
Figure 13. New Transfer Enrollment by Most Recent Institution Type22
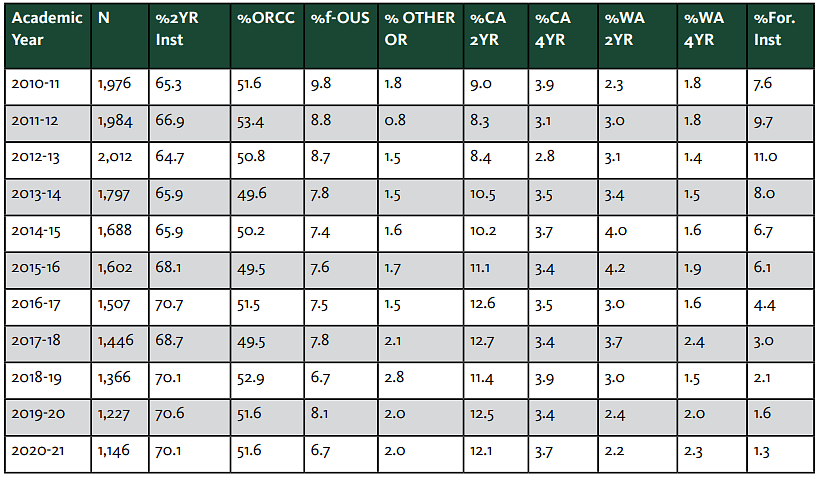
Considering that ORCC is the university’s largest institutional type for transfer students, it is not surprising that Lane Community College (LCC) serves as the university’s largest transfer partner. While LCC retains its status as UO’s largest transfer partner, the number of new transfer students from LCC has dropped 50%, from 586 to 291 (2010-11 to 2020-21). This is, in part, related to LCC’s own enrollment decrease. While a uniform and comparable measure of the population of community college students enrolling with an intent to transfer is not available, other measures of enrollment might offer a proxy for this measure. Various internal data sources suggest that the enrollment decrease at LCC ranges from 25% to 43% depending on the definition of transfer intent – less than the 50% drop noted above. In comparison, the university’s second largest partner, Portland Community College (PCC), only experienced a 3% enrollment drop over this same period but its degree/ certificate-seeking population dropped by 18%, which is comparable to the overall enrollment population.23 Approximately 22% fewer students are enrolling from PCC, from 133 students in 2010-11 to 104 students in 2020-21. It is evident that UO’s feeder institutions are also experiencing enrollment loss. This loss impacts UO transfer enrollment, but it does not fully account for the level of loss among this student population.
Transfer Enrollment Summary
The data demonstrate that the decline in new transfer enrollment is pervasive and cannot easily be explained by a single factor. There are multiple contextual factors influencing this decline, but the UO experience is not shared by all f-OUS institutions or by its AAU peer institutions. Therefore, an examination of the applicant funnel is necessary to understand if the loss of enrollment is related to these contextual factors and/or changes in institutional practices and policies that could constrain this funnel.
Transfer Admission Funnel
The section that follows investigates the transfer admission funnel, starting from when interested students apply to transfer to UO. Each of the admission metrics – applications, admission rate, and yield rate – are examined by institutional and demographic characteristics. Where possible, national and state data are included as benchmarks. It is important to note that institutions are not required by federal law to report on their applicant funnel. Additionally, applicant funnel data are not collected by Oregon’s Higher Education Coordinating Commission (HECC) and, therefore, benchmarked data are limited.
Applications
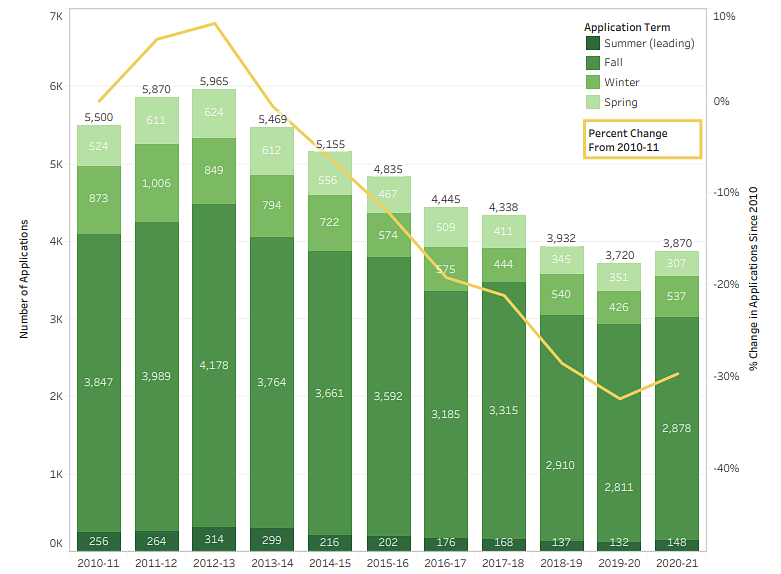
Given the declining enrollment of transfer students, it is not surprising that the number of transfer applications has steadily declined since the 2012-13 peak, apart from the most recent year (see Figure 14).
Figure 14. Transfer Applications Across 10 Years
Applicant Characteristics
In addition to the decline of applications, there has been a shift in both demographic and institutional characteristics of these applicants. These shifts are consistent with enrolled students, mainly: fewer international students, greater domestic diversity, and declines in students entering without a declared major (see Figures 15 – 17). Throughout the ten-year period there has been little change in the distribution of the class standing of applicants; consistently 60% of students apply with fewer than 90 earned transfer credits. Additionally, while the average transfer GPA of applicants declined from 3.13 in 2010-11 to 3.07 in 2015-16, this measure has improved in recent years. The applicant pools in the last two years had the highest average GPA during the ten-year period (3.15 GPA).
Figure 15. Transfer Applications: Demographic Characteristics
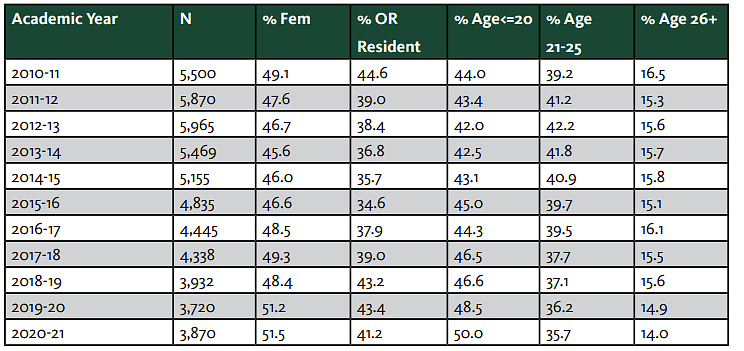
Figure 16: Transfer Applications: Federal Race/Ethnicity Categories

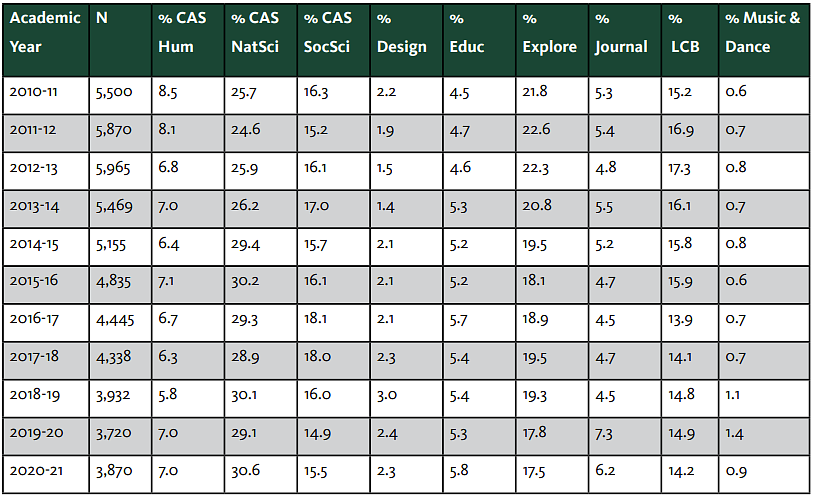
Figure 17: Transfer Applications: School/College of Admission Major
While there is much similarity and stability among both populations (applicant and enrolled students), they differ in a few areas of note. The percentage drop of applications is smaller than the decrease in enrolled students, suggesting that the drop-in enrollment is not solely explained by declining interest in the university. The 2020-21 admission data also demonstrate an increase in the number of applications. Before interpreting this as a trend reversal, another cycle of data is needed. The increase in applications may be the result of larger enrollment changes due to the COVID-19 pandemic. Specifically, national research has demonstrated that the pandemic has impacted student choice behaviors – more students are staying closer to home (Baer & Martel, 2020; Soria, 2020). Since the uptick in applications did not translate into additional student enrollment and the growth was among resident students, the increase may be a byproduct of the pandemic.
Transfer Institution Type
As previously noted, many Oregon community colleges have experienced their own drops in enrollment, which is a significant contributing factor in the reduced number of transfer applications. In fact, applications from students originating at Oregon’s two- and four-year public institutions reached their peak in 2011-12, one year earlier than Figure 14, presented in the previous section, might suggest.24 Current-year applications from Oregon public institutions are 33-40 percent lower than the number of applications received in 2010-11 (see Figure 18). The reduction in transfer applications from students originating at foreign colleges is even more striking. This part of the funnel peaked at over 1,000 applications before shrinking more than 80%.
Figure 18. Transfer Applications: Numbers and Year-over-Year Change by Institution Group25
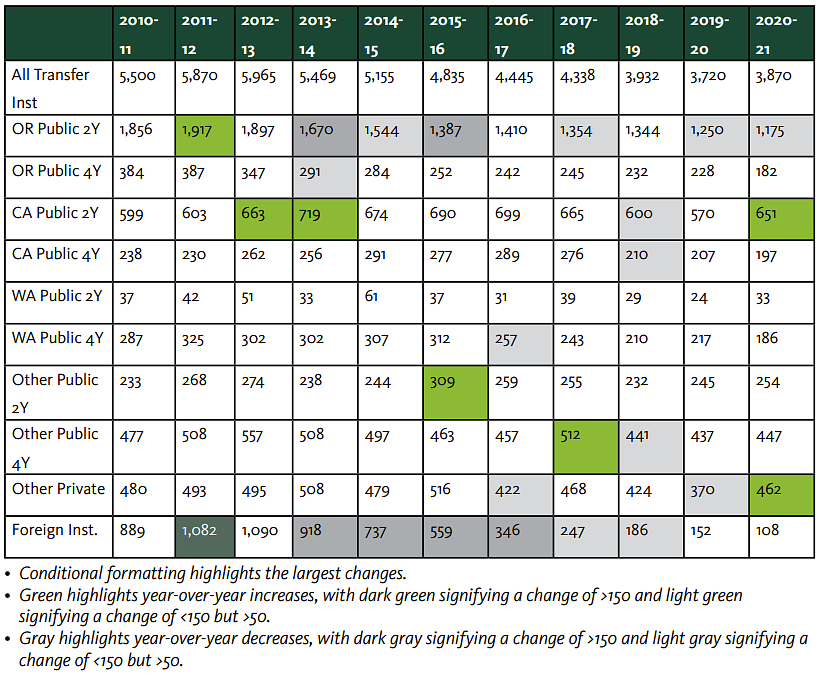
The timing of these decreases is of interest (see Figure 18). Although drops in international student enrollment are often associated with the Trump administration’s change in immigration policies and the global COVID-19 pandemic (Baer & Martel, 2020), the university’s declining number of transfer applicants from foreign schools began well before this. These earlier drops in international applicants are not consistent with national trends that report international student growth for most institutions in Fall 2013 and Fall 2014 (IIE Center for Academic Mobility Research and Impact, 2013 & 2014). Additionally, while the most recent drop in applications from Oregon’s 2-year institutions is consistent with national trends (Causey et al., 2020), more investigation is needed to understand the large drops in 2013-14, 2014-15, and 2015-16.
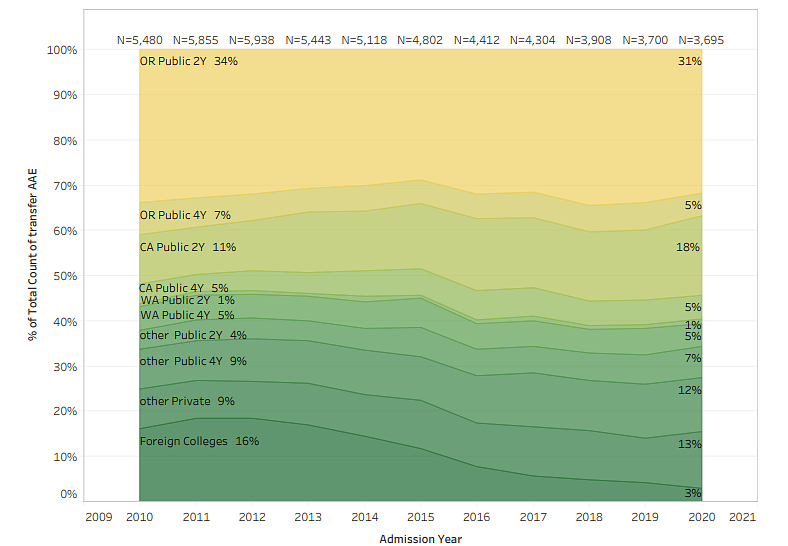
The proportion of applications from Oregon public institutions has decreased slightly, from 41% in 2010-11 to 36% in 2020-21 (see Figure 19). In contrast, the proportion of transfer applications from California’s public 2-year institutions has grown, increasing from 11% to 18%. Other institutional groups have also increased their representation by modest amounts. However, the university’s relative reliance on applications from Oregon’s public institutions – particularly Oregon community colleges – has not significantly lessened.
Figure 19. Transfer Applications: Percent of Applications by Institution Gruop26
Applicant Funnel
We find that not only are the number of transfer applications declining, but the overall profile of transfer applicants is shifting in meaningful ways. To assess whether these changes are caused, in part, by systemic changes in the application funnel, the application completion rate, admission rate, and yield rate were examined across residency types (see Figure 20).
Figure 20. Transfer Applications: Applied, Admitted and Enrolled by Residency
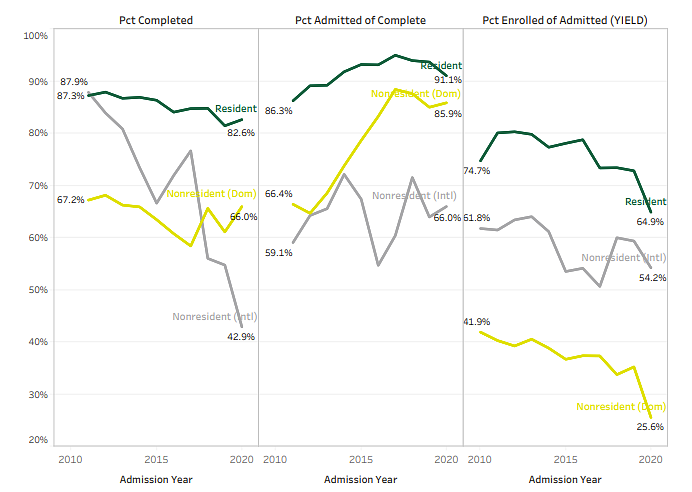
Consistent with data presented earlier, metrics for international students demonstrate a general decline of student interest as evidenced by a decrease in application completion rate, and variable rates of admission and yield. Of the three metrics examined, only admission is controlled by the institution. The variable rate of admission for international applicants does not reflect a change of admission practice; rather, it is a function of university practices in tracking and reporting these applicants. Applicants who are required to complete additional English language requirements are conditionally admitted to the university and do not count as admits for university tracking purposes. Since the number of international applicants is small, the data can be skewed by the number of applicants who are conditionally admitted.
By contrast, both resident and domestic nonresident applications have had increasing admission rates since 2010. This increase is much larger for nonresident applications, with an increase of over 20 percentage points. The increase to the admission rate for nonresident applications is likely influenced by a few factors: declining numbers of prospective students in Oregon, changing financial considerations requiring the university to prioritize revenue generation strategies rather than state appropriations, and a declining yield among this population.
Finally, given the different patterns for residents, domestic nonresidents, and international nonresidents, we also explored demographic characteristics nested within residency status. Our findings revealed that for resident applicants, the completion rate for females has declined more than the completion rate for males. Across all residency categories, female applicants have a higher admission rate; however, their yield is generally lower. We also found that the completion rate for underrepresented domestic minority (URM)27 applications is somewhat lower than for non-URM, though not consistently. While the admission rate of URM applications has historically been lower, the gap appears to be closing.
While there was interest in further disaggregating by individual racial and ethnic groups, the counts for many of these groups were not large enough to draw any conclusions. Additionally, both first generation and Pell eligibility were of interest but due to data concerns and limitations, they could not be included in this analysis.
Summary and Recommendations
The data demonstrate that transfer enrollment at the University of Oregon is declining with little evidence that the trend will reverse itself without intervention. Data show that this decline is not simply a function of lower community college enrollment, but it is a complex interplay of the loss of the international student population, more competition within the transfer landscape, and overall, less interest in the institution as a transfer destination. Although transfer students are fewer in number, they remain successful at the institution and contribute to the overall fiscal health and the diversity of the campus. Further, a stable transfer population communicates an institutional commitment to Oregon and its people.
The state’s recent legislative actions (e.g., major transfer maps, approval of applied baccalaureate programs, common course numbering) and changes to its budget model highlight its commitment to the transfer student population. However, this statewide commitment is not yet reflected in the university’s numbers. As mentioned earlier, the university has the lowest proportion of transfer students to new student enrollment in the state and has dropped to the bottom quartile among its AAU peers on this metric. Therefore, the university appears to be at a decision point – continue the status quo or make a deeper investment in the transfer population to begin to turn this tide.
To some extent, the university has already begun to step toward deeper investment to this population which is evidenced via the presentation to the Board of Trustees in March of 2021 where the Student Services and Enrollment Management (SSEM) unit, Undergraduate Education and Student Success (UESS) unit and the Division of Student of Life presented the transfer landscape. These units are actively engaged in improving transfer pathways and their work is already having an impact. At the same time, greater success requires further institutional commitment and faculty involvement. Competition for transfer students both locally and nationally is steep. Between competitive scholarship programs and online programs, the university will need a commitment of both financial and faculty resources to reverse this trend. Programs like the Transfer Ducks Scholarship, which was launched in Fall 2020, will need to be expanded if found to be effective. Additionally, the creation of the state-mandated major transfer maps, expansion of academic offerings, and more flexible delivery of curriculum must be guided by faculty. For the university to regain and grow the transfer population, administrative units and faculty must be full partners.
In putting this work together, the Academic Data Analytics (ADA) unit does not aim to provide the solution for the declining transfer enrollment trend. Rather, the goals were to provide trend and benchmarked data to help senior administrators as they decide how the institution will respond to continued legislative action to improve the transfer experience, the university’s reputation as a transfer institution, and the institutional stakeholders’ call for additional investment in the transfer population. Although determining the solution was not the call to action, continued partnership remains a priority of the ADA unit. Specifically, the work that is yet to come will help guide UESS as it aims to “eliminate or decrease real or perceived barriers to easy transfer.”28 In partnership with the Office of the Registrar, the ADA unit has begun to develop an academic progress dataset. This dataset will leverage student-level data from UO’s degree guide to better understand how students’ progress through an academic major, including assessing the role of transfer credits in degree progression. Future analysis will help academic and administrative units better direct resources to eliminate barriers to degree progression. This work stands to not only support transfer students but also first-time students, the majority of which enter the university with some form of college credits.
The continued exploration and focus on the transfer student experience aligns well with several of the Provost’s principles for university initiatives: to catalyze growth toward national leadership of the university within that field; align research and scholarly strength with educational impacts, and student interest and success; leverage unique strengths of the University of Oregon; resonate with Oregon values and Oregon as a place; directly address our mission as a public institution in Oregon; and enhance the future financial stability of the university. Additionally, it signals an institutional commitment that mirrors the state’s commitment by prioritizing the transfer student experience.
References
Baer, J. & Martel, M. (November 2020). Fall 2020 international student enrollment snapshot. IIE Center for Academic Mobility.
Causey, J., Harnack-Eber, A., Lang, R., Liu, Q., Ryu, M., & Shapiro, D. (December 2020). COVID-19 transfer, mobility, and progress. Report No. 2. Herndon, VA: National Student Clearing House Research Center. Institute of International Education (November 2013). Fall 2013 international student snapshot survey: A brief report. IIE Center for Academic Mobility Research and Impact. https://www.iie.org/Research-and-Insights/Open-Doors/ Fall-International-Enrollments-Snapshot-Reports
Institute of International Education (November 2014). Fall 2014 snapshot survey of international student enrollment: A brief report. IIE Center for Academic Mobility Research and Impact. https://www.iie.org/Research-and-Insights/Open-Doors/FallInternational-…
Institute of International Education. (November 2015). Fall 2015 snapshot survey of international student enrollment: A brief report. Institute of International Education. IIE Center for Academic Mobility Research and Impact. https://www.iie.org/Research-andInsights/Open-Doors/Fall-International-…
Knight, B.G. & Schiff, N.M. (August 2019). Reducing frictions in college admissions: Evidence from the common application. Working Paper 26151. Cambridge, MA: National Bureau of Economic Research. http://www.nber.org/papers/w26151
Soria, K. M., Roberts, B.J., Horgos, B., & Hallahan, K. (2020). The experiences of undergraduate students during the COVID-19 pandemic: Disparities by race and ethnicity. SERU Consortium, University of California – Berkeley and University of Minnesota.
Endnotes
- Data Source: Institutional Research Fall Census data.
- Retention and graduation rates produced by ADA based on transfer (Student Achievement Measure) cohorts.
- 2017 Regular Session, House Bill 2998: https://olis.oregonlegislature.gov/liz/2017R1/ Downloads/MeasureDocument/HB2998/Enrolled
- https://www.oregon.gov/highered/policy-collaboration/Pages/transfer-299…
- 2019 Regular Session, Senate Bill 3: https://olis.oregonlegislature.gov/liz/2019R1/Downloads/MeasureDocument…
- As of summer 2021, no four-year degree programs have been approved at Oregon’s community colleges.
- https://www.oregon.gov/highered/institutions-programs/postsecondary-fin…
- 2021 Regular Session, Senate Bill 233 https://olis.oregonlegislature.gov/liz/2021R1/ Downloads/MeasureDocument/SB233/Enrolled
- Semi-Annual Report on Student Success: A Focus on Transfer and Non-Traditional Students https://trustees.uoregon.edu/may-2021-bot-meeting-materials
- https://www.studentachievementmeasure.org/
- https://nces.ed.gov/ipeds/use-the-data/survey-components/11/outcome-mea…
- https://www.studentclearinghouse.org/colleges/studenttracker/
- New transfer enrollment is based on new transfers students who have greater than 0 credits at their first term census; this is consistent with IPEDS reporting. In addition, international exchange students have been excluded.
- Discrepancies between term enrollment and IPEDS enrollment are due to the inclusion of transfer students who started in the summer and continued into the fall term for IPEDS reporting.
- OSU Ecampus https://ecampus.oregonstate.edu/about/top-ranked.htm (last accessed 9/6/21).
- Oregon Tech Online https://www.oit.edu/online (last accessed 9/6/21).
- UO Online https://online.uoregon.edu/ (last accessed 9/6/21).
- https://scholarships.oregonstate.edu/2021-2022-scholarships-new-osu-stu…
- https://www.pdx.edu/student-finance/transfers-finish-free
- SOC (students of color) include students who identified as one of the following federal ethnic/racial groups: American Indian or Alaska Native (AIAN), Asian, Black or African American, Hispanic or Latino, Native Hawaiian or Other Pacific Islander (NHPI), or Two or More Races. Although the term SOC is used throughout the report, specific racial and ethnic groups are listed as often as possible.
- Two-year institutions were defined as such by their Carnegie Classification mentioning associate degrees or, if this was not available, the university’s internal reporting of level designation was used.
- Most recent institution is determined prior to enrollment based on the student’s dates of attendance. If the student was enrolled at multiple institutions during the same period, then credits earned at the institution is used as a tie breaker, with greater credits resulting in being defined as the most recent institution.
- This figure is based on IPEDS reporting, which only includes students who are enrolled for credit. However other data sources may include students enrolled in not-for-credit courses or programs, including Adult Basic Skills, English Language Learners, and Community Education; for example, from Oregon’s Higher Education Coordinating Commission (https://www.oregon.gov/highered/ research/Documents/Student/CC-Fall-4th%20week-Headcountby%20Institution.pdf)
- This initial tapering was masked by increases from other institutional groups, such as two-year public institutions in California and four-year public institutions in California and elsewhere.
- Applications for which the transfer institutions are unknown are not presented in Figures 17 and 18. Recent changes to UO data systems resulted in an increased number of applications for which the transfer institutions are unknown for Winter and Spring 2021.
- Yearly transfer numbers appear slightly smaller in this graph due to missing transcript records for some transfer students.
- URM (underrepresented minority) include students who identified as one of the following federal ethnic/ racial groups: American Indian or Alaska Native, Black or African American, Native Hawaiian or Other Pacific Islander, or Hispanic or Latino.
- UO Board of Trustees Meeting Materials, March 2021, p. 240.